


Get FP&A best practices, research reports, and more delivered to your inbox.
Benchmarks reflect full-year 2025 data
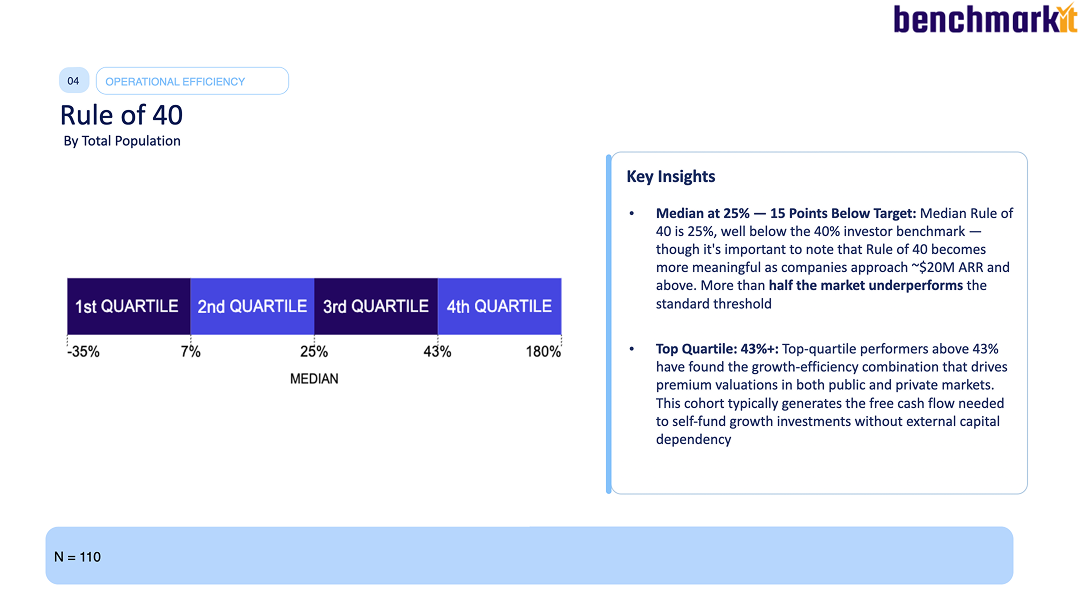
The median B2B SaaS company posted a Rule of 40 score of 25% in 2025 — still 15 points below the 40% investor benchmark, but a 10-point jump from 15% the year before, the largest single-year gain in five years of benchmark data. Top-quartile companies clear 43%. These figures come from 342 SaaS and AI-native companies in the 2026 Aleph × Benchmarkit SaaS & AI Performance Benchmarks.
So a “good” Rule of 40 in 2026 is still 40%+ — the bar has not moved — but the typical company is closer to it than at any point since 2022, and the gap between the median and the top quartile is where the real story is.
{callout}
Bottom line: 40% remains the target, and the top quartile (43%+) is the realistic aspiration. But more than half the market is below the line, the 2025 median is 25%, and the metric only becomes meaningful above roughly $20M ARR. Below that, growth rate matters more than the Rule of 40.
{/callout}

What is the Rule of 40, and what's a good score?
The Rule of 40 says a healthy SaaS company's revenue growth rate plus profit margin should sum to at least 40%. It is a single number that captures the growth-versus-profitability trade-off: you can grow fast and burn, or grow slowly and profit, but the combination should clear 40%.
Against the 2025 data:
- 40%+ — good. The investor benchmark and the top-quartile threshold (43%).
- 25% — median. More than half the market is here or below.
- 7% — bottom quartile. Newly positive: the 25th percentile moved from -4% in 2024 to +7% in 2025.
The whole distribution improved in 2025, not just the leaders — a market-wide efficiency recovery.
How do you calculate the Rule of 40?
Rule of 40 = Revenue growth rate (%) + Profit margin (%)
The nuance is which margin you use:
- EBITDA margin is the most common and the basis for most published benchmarks.
- Free cash flow margin is stricter and increasingly what late-stage investors prefer.
- Operating margin sits between the two.
Use the same margin definition every period and when you benchmark — mixing FCF margin against an EBITDA-based benchmark is the most common way the comparison gets distorted.
Why did the median Rule of 40 jump 10 points in 2025?
The 10-point gain — from 15% to 25% — came almost entirely from the profitability side of the equation, not from faster growth. In the same year, the median company cut R&D by 8 points (35% → 27% of revenue), S&M by 2 points (37% → 35%), and G&A by several points, while growth actually decelerated to a 20% median.
That is the tension worth naming: the Rule of 40 improved because companies spent less, even as growth slowed. Whether 2025's gain holds depends on whether that efficiency is structural or a one-time reset. The report frames it as an open question, and so should any board reading these numbers.

How does the Rule of 40 vary by growth rate?
The Rule of 40 is heavily shaped by where you sit on the growth curve — and the middle is the hardest place to be:
The 31–50% cohort landing below the slow-growth cohort is the most instructive finding here. Achieving that growth rate requires investment that compresses margin faster than the growth contribution offsets it. Pairing high growth and high profitability requires exceptional product-market fit and GTM efficiency at the same time — which is exactly why so few companies clear 40.
How does pricing model affect the Rule of 40?
Pricing architecture shows up in the Rule of 40, just as it does in retention. Subscription + usage (hybrid) companies post the highest 75th percentile at 43%, just clearing the 40 threshold — the hybrid model pairs predictable base revenue with consumption-driven expansion. Non-seat subscription companies trail at an 18% median, often because they are in an active market-expansion phase where investment has not yet converted to efficiency.
This connects to the broader 2025 finding that usage-based models compound faster — the same dynamic that gives them a 10-point net revenue retention advantage.
At what size does the Rule of 40 start to matter?
The Rule of 40 becomes a meaningful benchmark at roughly $20M ARR and above. Below that, the math is noisy: a small revenue base makes growth rates volatile and margin swings large, so the combined score swings with them. For early-stage companies, growth rate and unit economics like CAC payback are the more honest signals. The Rule of 40 earns its place as companies scale into the range where investors actually price on it — and it is a fixture of the quarterly board reporting pack.
How does the Rule of 40 relate to the other 2025 benchmarks?
The Rule of 40 is an output, not an input — it summarizes decisions that show up in more specific metrics:
- Growth rate (20% median, declining for four straight years) is the growth half.
- Operating efficiency — R&D, S&M, and G&A ratios — is the margin half.
- GTM efficiency — CAC payback (16 months) and the Magic Number (1.37) — determines whether you can reinvest in growth without dragging the score down.
The report's practical guidance: before adding GTM spend to chase growth, check whether your NRR, GRR, CAC payback, and Magic Number are top-quartile. If they are, investing to grow lifts the Rule of 40. If they are not, more spend mostly lowers it. For related SaaS benchmarks, see gross margin and ARR per employee.
How should finance teams benchmark and improve their own Rule of 40?
- Lock the definition. Pick a margin basis (EBITDA, FCF, or operating) and hold it constant across periods and benchmarks.
- Decompose before you act. A 25% score from 30% growth and -5% margin is a very different company from 5% growth and 20% margin. The blend determines the move.
- Do not optimize the score directly. The Rule of 40 improves when growth and margin improve. Cutting to hit the number — the way much of the market did in 2025 — can show up as a higher score and a weaker business.
Tracking it well means having growth and margin in the same live model, sliced by segment. Aleph connects the GL and the revenue data so the Rule of 40 — and the growth and margin components underneath it — update as actuals land, instead of being reassembled by hand each quarter for the board deck.
See how finance teams track the Rule of 40 and its components in Aleph → Book a demo.
Methodology and sources
These benchmarks come from the 2026 SaaS & AI Performance Benchmarks report, published jointly by Aleph and Benchmarkit on June 1, 2026. The report draws on 342 B2B SaaS and AI-native software companies; Rule of 40 figures are based on the 110 participants that reported the metric. Figures reflect full-year 2025 (CY-2025) actuals. The underlying metrics are explorable in Benchmarkit's interactive benchmarks.
{callout}
A note on the year: This report was published in 2026, but the benchmarks reflect full-year 2025 results — the latest complete data. Where this page says “2025,” it means the data year. “2026” refers to the report edition and the current planning year.
{/callout}
This page is reviewed against each new edition of the benchmark data.
Get FP&A best practices, research reports, and more delivered to your inbox.