

Jim Collins’ adage that “good is the enemy of great” applies to many areas of life. But when it comes to data quality in FP&A, it’s just the opposite. Perfect data is a myth, and pursuing it can do more harm than good. Too many FP&A teams get stuck chasing this unattainable ideal and end up paralyzed because their data isn’t "clean enough."
This isn’t to say that data quality is unimportant. Consolidated, well-structured data is the foundation for precise models and forecasts.
But here’s what separates the best FP&A teams from the rest: they don’t let less-than-perfect data hold them back. They recognize that good data + great analysis beats perfect data + good analysis every time. Instead of obsessively fixing every last inconsistency, top teams focus on cultivating enough reliable data to power great decision-making.
This post is the first of a five part series on the the five core pillars of top-performing FP&A teams in 2025. Below will explore how FP&A teams can rethink their approach to data quality by cutting through the noise and focusing on what really matters.
FP&A’s unique data challenges
Imagine you get a call from your CFO asking for a revenue forecast on his desk by noon. You pull numbers labeled “Bookings” from your ERP, cross-reference “Closed-Won Deals” in the CRM, and then receive a file from billing titled “Net ARR.” Three systems, three different terms for the same metric. Hours later, you’re knee-deep in spreadsheets, manually reconciling the data.
This kind of chaos is just part of the job in FP&A. Nearly every key data stream in the organization is under your purview: headcount, revenue, expenses, inventory, etc., all of which are scattered across departments and tools.
Effective teams avoid getting stuck here not because they’ve achieved immaculate data, but because they’ve redefined what’s necessary for high-quality analysis. They treat data quality as a continuous process rooted in three core principles:
- Prioritizing critical gaps over comprehensive overhauls
- Automating tedious cleanup to reclaim time for analysis
- Building adaptable systems that evolve with the business
The truth is, there’s no finish line where data becomes flawless and stays that way. The best you can hope for is constant improvement—rolling up your sleeves and digging into transaction-level data when necessary, and knowing when it’s time to move forward with data that’s already strong enough to support great analysis.
The most important question
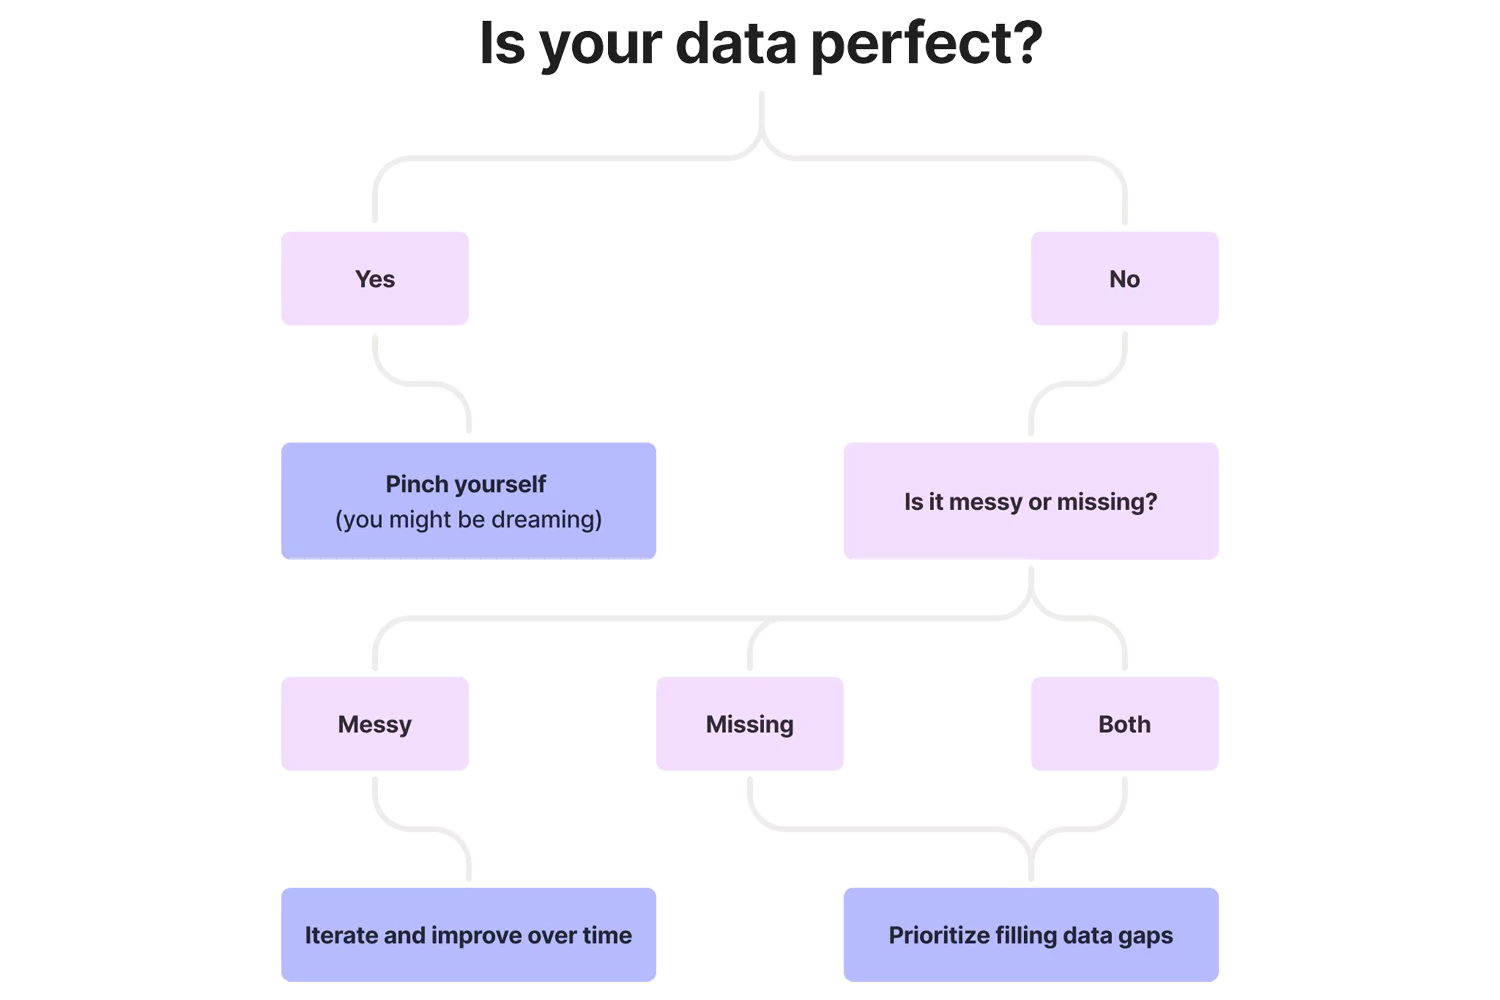
Before you even think about the quality of your data, you need to define the problem you’re facing: is your data messy, or does it not exist at all?
If foundational metrics are missing (e.g., a SaaS company that doesn’t have churn rate data), halt everything and focus on attaining that data. You can’t forecast recurring revenue without tracking which customers leave, and when they terminate their agreements.
Once you have all the data you need, you can proceed with getting it in good shape.
How to navigate the data quality spectrum
Not all data issues are created equal. Some inconsistencies are manageable; others are existential. The trick is knowing where to draw the line between the two.
Where great data is non-negotiable
Certain data points need to be airtight. If they’re off, even slightly, your entire financial picture can unravel.
Areas that demand pristine data include:
- Revenue and cash flow: Inaccuracies here distort forecasts, impact tax liabilities, and risk compliance issues.
- Headcount and payroll: If labor is one of your biggest costs, even small tracking errors can lead to budget blowups.
- Product/store profitability: Aggregated P&Ls hide winners and losers. Granularity is key here—a retail chain tracking only total sales might miss that 30% of its stores operate at a loss.
For these areas, perfection is non-negotiable. If that means going line by line to fix underlying issues, so be it.
When perfection isn’t practical
Outside of a few core metrics, chasing perfection is rarely worth the time and effort. Every business has some data flaws, and forcing uniformity across thousands of entries is usually futile.
For data that’s not quite mission-critical, smart teams focus on:
- Automating rather than micromanaging: A sales rep logs “Google LLC” in the CRM, while billing uses “GOOG.” Instead of manually correcting thousands of entries like these, smart teams use fuzzy matching and automated rules to clean up inconsistencies.
- Tolerating noise: Minor typos or formatting quirks that don’t impact decisions matter less than trend accuracy. If a regional sales memo misspells a client’s name, but the revenue number is right, it’s not worth fixing.
- Prioritizing speed over precision: A SaaS company doesn’t need 100% clean data on free trial users to forecast churn. A 90% clean sample is more than enough to spot trends and make informed decisions.
This is where many FP&A teams stall out. They prioritize precision over pragmatism, and get hung up on minor data inconsistencies.
Not all data issues demand a fix. Focus on what moves the needle, automate what you can, and move on.
Getting to Goldilocks data
The sweet spot lies in tracking enough data to inform decisions—but not so much that you’re paralyzed by complexity.
ERP example
- Too little: “Total IT spend: $1.2M” (no vendor breakdown).
- Too much: Every invoice line item for 75 SaaS tools.
- Just right: Track top 20 vendors, renewal dates, and subscription terms.
CRM example
- Too little: No lead source data on closed deals.
- Too much: Mandating 50+ dropdowns that reps ignore.
- Just right: Core dropdowns (deal stage, lead source, etc.) + open text for context.
A practical checklist for building better data
1. Define your North Star metrics
Before diving into cleanup, start by asking: what story does our business need to tell right now? Your answer dictates which metrics matter most.
For instance, if you're currently focused on fundraising, prioritize investor-facing metrics: customer acquisition cost (CAC) payback, loan-to-value (LTV) ratio, and burn rate. If your current priority is profitability, focus on indicators of operational efficiency: inventory turnover, same-store sales, and net retention.
Once you’ve identified these metrics, go back to the foundational question: does this data exist within our systems in the first place? If it’s missing, prioritize addressing that gap above all else.
2. Identify what’s important to leadership
Leadership doesn’t need more data. They need the right data. Finance should be in sync with the C-suite as to which metrics they need to drive decision-making.
- Cash flow and balance sheet metrics are universal priorities and should always be included in leadership reports.
- Financial metrics like revenue, gross margin, and EBITDA are vitally important as well.
- Operational metrics will vary by industry. A SaaS company might prioritize net revenue retention, while a retailer focuses on units sold per square foot.
The key here is focus. Align on 3-5 core metrics and ruthlessly eliminate everything else.
3. Outline your minimum viable data requirements
At this point, you have all the metrics you need to measure. The next step is to ensure you’re capturing the right level of detail without drowning in unnecessary complexity. A footwear brand, for instance, needs store-level revenue, inventory turnover, and foot traffic to gauge its performance. Tracking every SKU’s shelf placement, though, would be overkill.
To strike the right balance, ask yourself:
- Am I collecting data at the right granularity (e.g. product-level vs. category-level)?
- Is the data accessible based on our reporting schedule (e.g. weekly vs. quarterly)?
4. Assess your data’s structure and accessibility
No matter how pristine your data is, it’s essentially useless if it’s inaccessible or poorly structured. If pulling a simple report requires manually exporting and merging dozens of CSVs from your ERP, you have a workflow problem, not a data problem.
Shameless plug—this is exactly why we created Aleph's FP&A platform.
Once your data is easily accessible to those who need it, shift your focus to scrutinizing formatting. Dates, currencies, and units of measurement should be standardized across systems and teams.
5. Design outputs with your audience in mind
Just as important as cleaning and gathering your data is presenting it in a way that gets your message across effectively. A report that’s perfectly structured for one audience might be unreadable to another. PE firms may want Excel files with annotated assumptions that they can use to audit your calculations, while your CMO might prefer interactive dashboards that allow them to drill into marketing spend by channel and region.
6. Automate data collection and cleansing
Manually pulling, cleaning, and organizing data is a tax on productivity. Top teams eliminate this drudgery by leveraging tools like Aleph to:
- Sync systems seamlessly: Aleph keeps your data up-to-date at all times by automatically pulling from your ERP, CRM, HRIS, and other sources
- Standardize data: Aleph resolves data inconsistencies so “Google LLC” and “GOOG” don’t show up as separate entities in your reports
- Flag anomalies: Automated alerts highlight discrepancies, like unexpected expenses or missing revenue entries, before they turn into reporting headaches
💡 Pro Tip: Tired of manually monitoring endless rows of data to tidy up your vendor names? Don't worry, we sprinkled a little Aleph AI magic onto a free, simple tool that cleans and organizes your vendor list. Try it for free.
Smart data management in action
Data wrangling is a challenge for every FP&A team. But for a company like Hungryroot, rigid, one-size-fits-all reporting tools were especially cumbersome. Their finance team had to navigate a retail calendar that didn’t align with standard monthly reporting and track COGS with the added complexity of perishable inventory.
Their finance team was left with a clunky, time-consuming process that involved manually reconciling NetSuite data in Google Sheets and Excel. As Senior Finance Manager Connie Ho pointed out, “with all those steps, there's more room for human error throughout the process.”
Realizing that perfect data was a mirage, Hungryroot instead focused on the low-hanging fruit for improving their data management. They implemented Aleph to automate data extraction from NetSuite, remap COGS categories to reflect their unique cost structure, and align reporting with their retail calendar.
Aleph’s flexibility allowed them to push budget vs. actuals into Google Sheets for department heads while maintaining Excel for deeper analysis. Ho noted that “Aleph has been like half an analyst for us, where we can just get to the endpoint much quicker and cleaner than before.”
While their data still isn’t perfect, it’s much improved and no longer slows them down. That’s a win to be proud of.
If, like Hungryroot, you’re ready to tame your data chaos without getting bogged down in the details, Aleph’s free AI Vendor Cleanup tool can help. With just a few clicks, you can convert your raw, messy vendor list into a standardized and structured mappings file to keep you list clean. Try it for free today.

